Are Traffic Stops in Texas Racially Discriminatory?
A statistical analysis
This report was created in the Spring of 2018 by Prince Abunku, Te Du, Jon Kastelan and Jack Lundquist for "Data and Algorithms in the Criminal Justice System," a course taught by Ravi Shroff at NYU's Center for Urban Science + Progress. Special thanks to Sam Corbett-Davies and the Stanford Open Policing Project for their support, and to Sunglyoung Kim for his help on the visualizations.Introduction
In September 2016, the Austin American Statesman, a prominent daily newspaper in the state of Texas, released several reports documenting what they allege to be racial disparities in the Texas Department of Safety’s (DPS) stops and searches. Their primary statistical findings, which form an important piece of the article’s allegation of racially disparate treatment, were: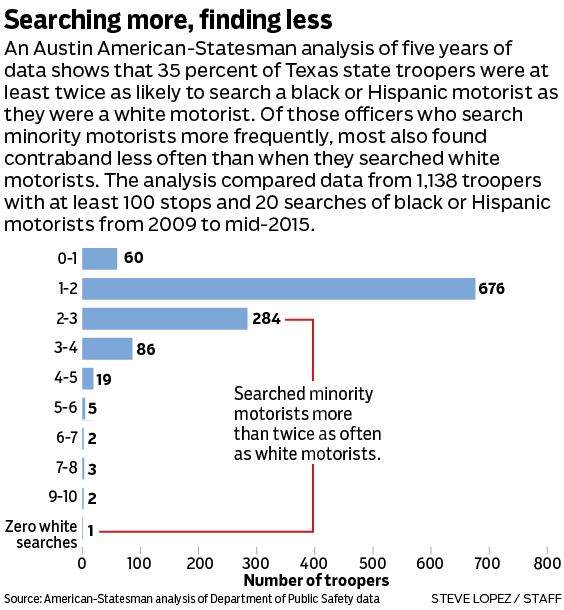
In their response to these unclear and inconclusive statistical insights, the DPS dismissed these claims as slanderous and unfounded, noting specifically the lack of “concrete evidence” in support of their rebuttal. Furthermore, after this report Steven McCraw, the director of DPS since 2009, went beyond this dismissal, going so far as to claim that the DPS has collected “compelling evidence” for 14 years proving that the DPS does not engage in racial profiling. However, an examination of the information collected by DPS in their annual reports on traffic stops shows that a claim of “compelling evidence” proving the lack of racial discrimination is exaggerated. Their evidence is a table of stops and searches broken down by racial group. They also provide information on the racial distribution of Texas’ population for comparison. The inference to be drawn from this comparison is that, because the racial distribution of stops and searches is similar to the racial distribution of the Texas’ population no racial discrimination exists in DPS’ stop and search practices. However, there are two large flaws to this conclusion. Firstly, a more accurate baseline to compare the racial distribution of stops and searches to would be the racial distribution of the driving population, not the population at large. The difference between the racial makeup of drivers and the population may differ significantly, making a comparison to the latter inconclusive. Secondly, evidence has emerged of the widespread misreporting of race by DPS officers. Many Hispanic drivers, it turns out, have been misidentified in the documentation of stops and searches as white. For this reason, any statistics on the racial distribution of stops and searches by the DPS is immediately subject to speculation, rendering conclusions from these data tough to reach.
All of this confusing and inconclusive evidence begs the question: can the extent and character of racial discrimination in traffic stops across the state of Texas be determined with more statistical certainty? Using data on DPS traffic stops (2006-2015) collected by the Stanford Open Policing Project, our team conducted four statistical tests in an attempt to answer this question. While the results of each test are subject to a fair amount of criticism (as will be discussed in more detail below), our conclusion, based on the most rigorous statistical analysis focused on the Texas’ DPS to date, is that the DPS discriminates against Texas' Hispanic population during vehicular stops and searches.
Our Approach
After reviewing the literature on statistical tests for discrimination, our team opted to conduct four tests, ranging from the simple to the complex: the benchmark test, the outcome test, the threshold test and the veil of darkness test. While each of these tests have their own limitations (to learn more about these tests, our methodology and our data sources, click here), conclusions that hold across these tests are most likely to represent the true extent and character of racial profiling in vehicular stops and searches conducted by the DPS.Our Analysis
Overview: Benchmark Test
The benchmark test compares search rates for various racial groups in order to conclude whether or not racial disparities exist in traffic searches. In this case, search rate is determined as the number of searches divided by the total number of stops for a given racial group in a given county. The interpretation of this test for its proponents are as follows: if the search rates for one racial group are higher than another, then that racial group is being stopped disproportionately, likely given some discriminatory practices on the part of the officer. Implicit in this interpretation is that the likelihood of containing contraband (thereby warranting a search) is equal across racial groups, which may or may not be true but is certainly hard to verify with certainty.Results
These scatterplots show the difference in search rates between white drivers and three groups of minority drivers: black drivers, Hispanic drivers and Asian drivers. Each point represents one county in Texas, where the size of the point is determined by the total number of searches of the minority driver being plotted (larger points = more searches). The y-axis represents the search rate for minority drivers in the county, and the x-axis represents the search rate for white drivers in the county. A 45-degree line is plotted to easily visualize all the points where the search rates of minority and white drivers are the same. If points are mostly below the 45-degree line, then white drivers are searched at higher rates than the given population of minority drivers across counties in Texas, implying favorable treatment for minority drivers. If points are mostly above the 45-degree line, then white drivers are searched at lower rates than the given population of minority drivers across counties in Texas, implying discrimination against minority drivers. If points are mostly around the 45-degree line, than drivers of both racial groups are searched at about the same rate, implying no demonstrable racial discrimination.The map highlights counties where the search rates for each minority group are significantly less than or greater than the search rate for the white population. A significance limit of two standard deviations had been applied. Counties where the difference in search rate is over two standard deviations away and in the lower tail indicate favorable treatment for the minority group being analyzed (i.e. lower search rates for that minority group). These counties are highlighted in blue. Counties where the difference in threshold is over two standard deviations away and in the upper tail indicate discrimination against the minority group. These counties are highlighted in red. The counties highlighted in grey indicate the differences between search rates are within a statistical range that suggest equal treatment of both white and minority population. The remaining counties (not shaded) were not included in our analysis.
Black and Hispanic drivers are both searched at higher rates than white drivers in the majority of counties in Texas. If one accepts the assumption that drivers of all racial groups have similar likelihoods of possessing contraband, one could conclude that Hispanic and black drivers are systematically discriminated against in vehicular stops and searches in the state of Texas. Asian drivers, however, are searched at lower rates than white drivers in the majority of counties in Texas. If one accepts the aforementioned assumption, one could conclude that Asian drivers are given more favorable treatment than white drivers and drivers of other minority groups in vehicular stops and searches.
Overview: Outcome Test
The outcome test compares the hit rate of searches for various racial groups in order to conclude whether or not racial disparities exist in traffic searches. In this case the hit rate is determined as the number of searches resulting in the recovery of contraband divided by the total number of searches for a given racial group in a given county. The interpretation of this test for its proponents are as follows: if the hit rates for one racial group are lower than another, then that implies a lower risk threshold being applied to the former racial group because more of those searches are not turning up contraband. The motivation for this lower threshold can be attributed to a racially biased mindset, and can be considered discriminatory. It should be noted, however, that this test makes some simplifying assumptions about the risk distributions for possessing contraband that call into question the certainty with which one can draw conclusions about risk thresholds.Results
These scatterplots show the difference in hit rates between white drivers and three groups of minority drivers: black drivers, Hispanic drivers and Asian drivers. Each point represents one county in Texas, where the size of the point is determined by the total number of searches of the minority driver being plotted (larger points = more searches). The y-axis represents the hit rate for minority drivers in the county, and the x-axis represents the hit rate for white drivers in the county. A 45-degree line is plotted to easily visualize all the points where the hit rates of minority and white drivers are the same. If points are mostly below the 45-degree line, one could conclude that officers across counties in Texas are conducting the search with a lower risk threshold for minority drivers, implying discriminatory treatment of minority drivers. If points are mostly above the 45-degree line, one could conclude that officers across counties in Texas are conducting the search with a higher risk threshold for minority drivers, implying discriminatory treatment of white drivers. If points are mostly around the 45-degree line, one could conclude that drivers of both racial groups are searched using the same risk risk threshold, implying no demonstrable racial discrimination.The map highlights counties where the hit rates for each minority group are significantly less than or greater than the search rate for the white population. A significance limit of two standard deviations had been applied. Counties where the difference in search rate is over two standard deviations away and in the lower tail indicate discrimination against the minority group being analyzed (i.e. lower hit rates for that minority group). These counties are highlighted in red. Counties where the difference in threshold is over two standard deviations away and in the upper tail indicate favorable treatment towards the minority group. These counties are highlighted in blue. The counties highlighted in grey indicate the differences between hit rates are within a statistical range that suggest equal treatment of both white and minority population. The remaining counties (not shaded) were not included in our analysis.
The hit rate of black and white drivers is about the same for counties across Texas, suggesting a similar risk threshold for both racial categories. Hit rates for Hispanic drivers, however, are significantly lower than their white counterparts across counties in Texas. This suggests a lower risk threshold is being applied to Hispanic drivers than white drivers, suggesting some discriminatory treatment in vehicular stops and searches. The hit rate for Asian drivers is either zero or one in many counties. This is because of the small number of searches conducted against Asian drivers in many counties in the State of Texas. Given that the sample size is so small for a significant number of counties, no conclusions about the threshold applied to Asian drivers can be drawn.
Overview: Threshold Test
The threshold test aims to account for this problem of inframarginality. The approach is well documented in two papers, The problem of infra-marginality in outcome tests for discrimination and Fast Threshold Tests for Detecting Discrimination.The problem of inframarginality relates to differing risk distributions or likelihoods that a suspect is carrying contraband, and search threshold of suspects.
The threshold test identifies a race-specific search threshold for which a subject (traffic stop / individual) will be searched if the officer deduces that the likelihood that subject is carrying contraband is greater than the threshold. If the likelihood of carrying contraband deduced by the officer is less than the threshold, the subject is not searched. If one racial group has a lower threshold for searching than another racial group, then one can conclude that the first racial group is experiencing discrimination through the application of this more stringent standard.
Results
For each county and race (Asian, Hispanic, black and white), the race specific search thresholds are estimated. To visualize, we plot the minority search threshold (y-axis) against white search threshold (x-axis) by county in a scatter diagram. The size of the point is determined by the total number of stops of the minority driver being plotted (larger points = more stops). The visualization is supported by a 45° line indicating where white and minority threshold are the same (i.e. if plotted on the line).This visual is useful for a cursory assessment of whether discrimination may be taking place. If there is a visible trend of observations consistently above, or consistently below the line this would be an indication of discrimination against the white or minority population respectively.
The scatter plots indicate equal treatment of black and Asian minorities when compared with white drivers, however the Hispanic minority plot shows a large majority of points scattered below the line. This indicates discrimination against the Hispanic minority as the threshold for conducting a search is lower than that for the white stops.
The map highlights counties where the thresholds for each minority group are significantly less than or greater the threshold for white population. A significance limit of two standard deviations had been applied. Counties where the difference in threshold is over two standard deviations away and in the lower tail indicate discrimination against the minority group (i.e. lower thresholds for the minority group). These counties are highlighted in red. Counties where the difference in threshold is over two standard deviations away and in the upper tail indicate favorable treatment of the minority group. These counties are highlighted in blue. The counties highlighted in grey indicate the differences between thresholds are within statistical range and suggest equal treatment of both white and minority population. The remaining counties (not shaded) were not one of the top 100 counties, and therefore removed from our threshold test analysis.
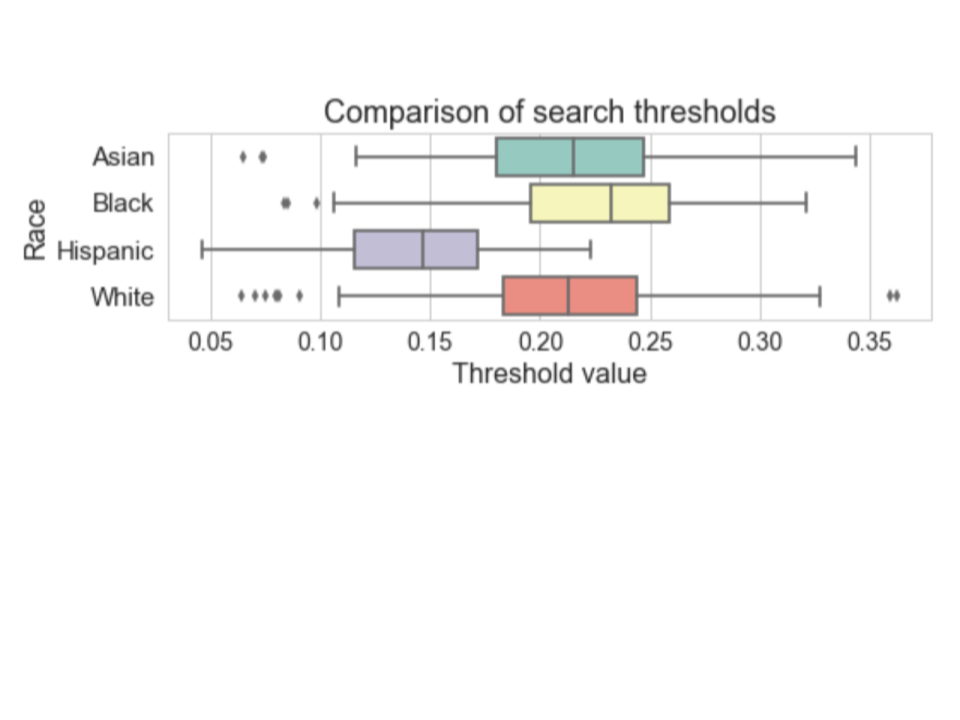
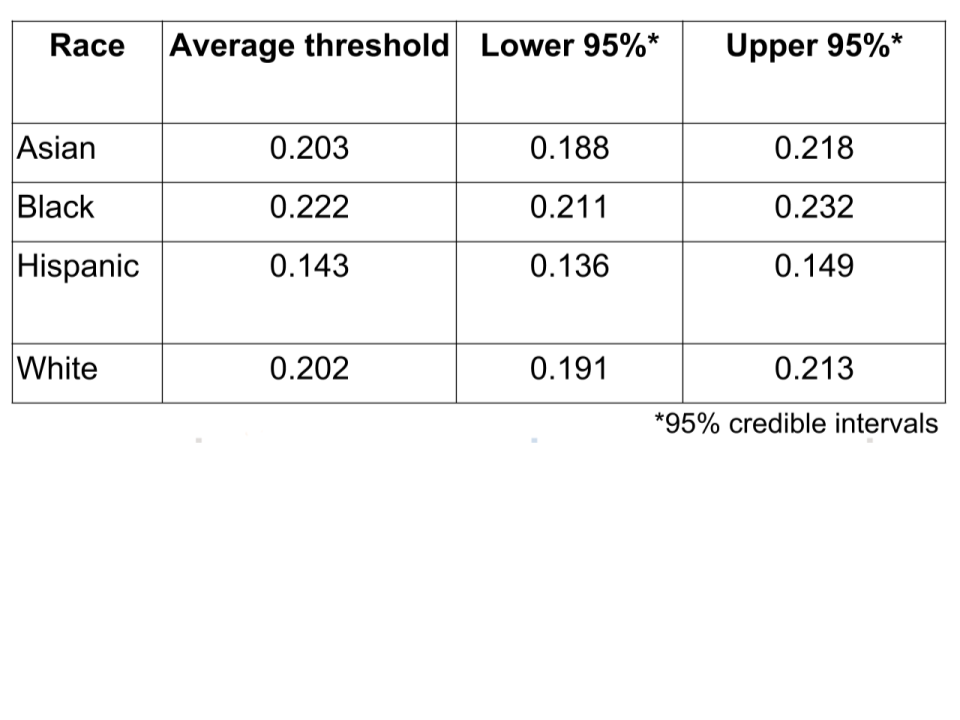
between the thresholds at the 95% level. The Hispanic interval on the other hand is distinctly separate and doesn’t overlap intervals for any of the other races. It has lower thresholds relative to the other thresholds indicating discrimination against Hispanic drivers.
While the test does indicate discrimination against the Hispanic population, there are a number of limitations to the threshold test, some of which are covered in further detail in our Methods and Data section.
Overview: Veil of Darkness Test
The veil-of-darkness test asserts that police are less likely to know the race of a motorist before making a stop after dark than they are during daylight. If it is assumed that racial differences in traffic patterns, driving behavior, and exposure to law enforcement do not vary between daylight and darkness, then it is possible test for racial profiling by comparing the race distribution of stops made during daylight to the race distribution of stops made after dark.Results
The veil-of-darkness (VOD) test uses two statistics to determine if there is discrimination observed against particular subsets of the population. The first one: Rb is the proportion of a particular race of driver among all drivers being stopped in a county before dark (before end of civil twilight). This is compared to Ra, the proportion of a particular race of driver among all drivers being stopped in a county after dark (after end of civil twilight). Discriminatory behavior against a particular race would be evident if the ratio of Rb and Ra is greater than 1. The implication of this test is that drivers of that race are stopped more often when visibility of race is better.Plotting the VOD results in a similar fashion to the other three tests. For each county, Rb and Ra estimated for each race. Rb is plotted on the x-axis and Ra is plotted on the y-axis. If the observation falls close to 45-degree line, then the race is neither favored or discriminated. If the observation falls below the 45-degree line, there is evidence to suggest the group is being discriminated against. If the observation falls above the 45-degree line, the evidence suggests the group is favored (i.e. stopped less during the day time).
The map highlights counties where the proportion of stops before dark for a given racial group are significantly less than or greater than the proportion after dark. A significance limit of two standard deviations had been applied. Counties where the difference in stop proportion is over two standard deviations away and in the lower tail indicate favorable treatment for the racial group being analyzed (i.e. that group is stopped less during the day when race can be seen than at night). These counties are highlighted in blue. Counties where the difference in threshold is over two standard deviations away and in the upper tail indicate discrimination towards the given racial group. These counties are highlighted in red. The counties highlighted in grey indicate the differences between hit rates are within a statistical range that suggest a lack of discrimination or favorable treatment. The remaining counties (not shaded) were not included in our analysis.
The results for Asian drivers are inconclusive due to the low number of stops in most of the counties. For black drivers, most of the counties line-up closely to the 45-degree line, suggesting no discrimination. For Hispanic drivers, there appears to be an inverse to discrimination in larger counties; namely for some counties, more Hispanic drivers are stopped after dark than during daytime.
Reviewing the application of the Veil of Darkness test for Texas stops; evidence for discrimination is not conclusive. For this implementation, we haven’t controlled for the time periods and have only considered the inter twilight period. This could mean differences in travel patterns at different time of the day are not accounted for. This is both a limitation of the test in general and also our implementation here. As discussed above, the visibility of race is assumed here to be a binary variable representing whether daylight is present. In practice, there is wide range of visibility likely to be much more subtle, not simply a binary 1,0 variable. In future this could be further explored by a richer dataset and more refined control over the lighting conditions at locations included in the test. Likewise for the temporal component, additional data might allow one to compare stops happening at the same exact hour, or even minute, before and after dark.
The Veil of Darkness approach is a clever and simple methodology, although still subject to significant limitations. The visibility of race might be impossible to measure. With even more stringent control over location and time, scenarios could easily be constructed such that officers can still distinguish races by types of vehicles or decorations on the vehicles.
Discussion
As indicated by the table below, most of the results from our analysis indicate equal, favorable or inconclusive assessment of discrimination against minority drivers during DPS’ vehicular stops and searches. The exception is with Hispanic drivers, for which three out of four tests conducted suggest the presence of racial profiling. A major limitation of this analysis is that driver race had to be estimated given systematic misclassification by the DPS: the conclusion that Hispanic drivers likely experience racial profiling during the DPS’ vehicular stops and searches hinges upon the accurate imputation of race conducted by the Stanford Open Policing Project (the providers of our data), which is hard to get a sense of given the lack of actual data on driver race.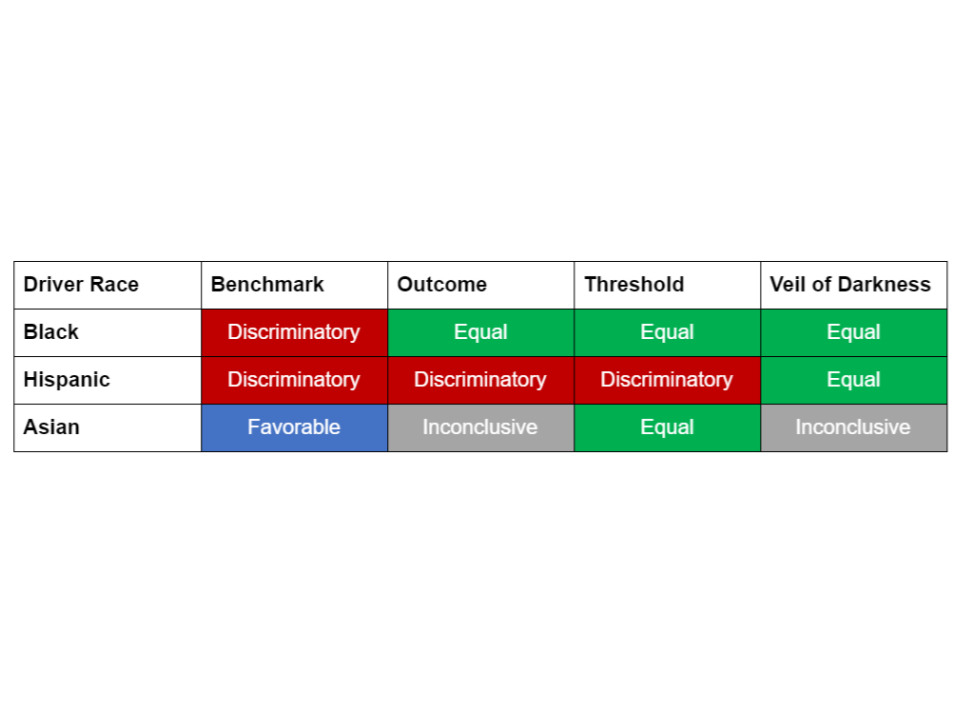
Nonetheless, the finding of a strong likelihood that racial profiling is present against Hispanic drivers should be motivation for the DPS to take more seriously the issue of racial profiling, which until recently they have denied existed based on their own analysis.
More recently, after reporting by the Austin American Statesman and other publications on racial profiling, DPS in the summer of 2017 committed to a broader examination of racial profiling. The examination itself has been subject to some criticism , given that the expert picked has ties with police, and the DPS still denies that racial profiling is taking place.
The DPS is legally mandated by the State of Texas to conduct an analysis of racial profiling, which itself is illegal under state law. State Bill 1074 , signed into law on June of 2001 and made effective on September 1st, 2001, updated the code of criminal procedure to explicitly prohibit racial profiling by law enforcement officials in the state. It also updated the code to mandate a written policy on racial profiling. This policy must define acts of racial profiling, prohibit officers from engaging in those acts, provide an actionable public means of complaint and education about those means, and require the collection and reporting on of information on motor vehicle stops conducted by officers. While this data is legally not prima facie evidence of racial profiling, the law does mandate some analysis by law enforcement agencies to determine the extent and character of racial profiling during these stops.
In order to draw any conclusions as to whether or not our analysis is suggestive of illegal acts of racial profiling by the DPS, two questions based on this relevant excerpt of the code of criminal procedure emerge.
First, what acts constitute racial profiling, according to the DPS? If the DPS is abiding by the code of criminal procedure, these acts must be written down somewhere. A “Traffic Stop Data Report” from October of 2000 suggests that this information is recorded in “Chapter 1, Annex 1” of the “Traffic Law Enforcement Manual,” but after a lengthy search of online sources we were not able to recover any records documenting the DPS’ policy defining racial profiling and the measures taken to address it. This is unfortunate because it makes us unable to conclude whether or not our analysis demonstrating the likely presence of racial profiling is an indication of illegal behavior. It is also unfortunate because it means that the public is unable to hold the DPS, an agency devoted to protecting public safety that has been charged at times with doing the opposite, accountable. The DPS should make their definition of racial profiling and the practices they engage in to prevent it widely available, so that they can be held accountable by the public and so that analyses of their vehicular stop and search practices can be characterized in a legal manner.
Second, what standards are applied to the reporting and analysis of racial profiling data, and is the DPS meeting these standards? According to the Texas Commission on Law Enforcement (TCOLE), the organization responsible for regulating Texas’ law enforcement agencies, there are two sets of standards that apply to agencies conducting vehicular stops and searches. The “partially exempt” tier, which DPS falls under because they have installed video and audio equipment on their vehicles, exempts the DPS from having to conduct any analysis of racial profiling. They simply have to provide data on:
Even if the DPS fell into the non-exempt, “full report” tier, the additional requirements would not necessarily result in a meaningful statistical analysis of racial profiling. While a full report does include data on search outcomes, making an outcome test possible, the analysis required in this report makes no mention of any specific statistical test or standard of statistical rigor. Rather, the guideline requires a “comparative analysis” of the number of stops experienced by minority drivers and white drivers and the racial distribution of stops and searches conducted by individual officers. The first part of this “comparative analysis” makes no indication that a normalizing factor is necessary to contextualize the raw count of stops (not to mention that there is no indication of any analysis examining the outcomes of these stops and searches), setting the statistical standard below even that of the benchmark test (which has the lowest statistical standard out of our four tests, demanding the simplest normalization of the data used). And the second part of this analytic approach is limited by the sample size associated with individual officers, making it hard to draw conclusions about racial profiling at large.
As the answer to these questions demonstrate, while the DPS may be following the letter of the law (e.g. reportedly using a written policy on racial profiling, reporting necessary data), they are not necessarily following the intent: to prohibit racial profiling, define it, enact policies to prevent it, and collect data to analyze it. The DPS may have a rigorous definition of racial profiling and a comprehensive strategy to prevent it, but if they do it is not easily available to the public, making it impossible to hold the DPS accountable and impossible to determine whether or not they are engaged in illegal racial profiling. The DPS may collect and report data on vehicular stops and searches, but they do not analyze this data or reach any conclusions as to the presence of racial profiling in their ranks. Whether this is out of a lack of resources, a lack of interest or a lack of belief in the presence of racial profiling is immaterial, as the result is uninformed public discourse, a lack of transparency and trust in DPS, and a lack of meaningful change intended to address an issue many citizens in Texas believe to be critical. While this status quo may be legal, it is socially unacceptable.
Racial profiling during vehicular stops and searches violate this country’s legal and ethical norms, and can result in severe human impacts. Our analysis of data on traffic stops and searches conducted by Texas’ Department of Public Safety suggests a strong likelihood of racial profiling against Texas’ Hispanic drivers. While the DPS is technically following the letter of the law with their approach to managing racial profiling, they are not owning up to the likely presence of profiling by their officers through a more diligent analysis or attempt at transparency. To go about addressing both the likelihood of racial profiling and the failure of the DPS to manage this critical issue with transparency and accountability, the DPS should start with a rigorous and impartial analysis of racial profiling during stops and searches conducted by their officers. This analysis should include statistical tests like the ones our team has conducted, but should also include interviews with relevant stakeholders and a thorough review of legal and procedural documents. This analysis should also be complemented by efforts to improve transparency around the department’s policies and practices when it comes to vehicular stops and searches: in other words, the public should easily be able to learn what the DPS defines as racial profiling and what they are doing to ensure it does not occur. And finally, given that our analysis does suggest a strong likelihood of racial profiling against Hispanic drivers, we recommend the DPS enact mandatory training aimed at combating implicit and explicit racial biases. While our results are far from conclusive evidence of racial profiling by the Texas Department of Public Safety, the suggestion of profiling in our analysis, the lackluster state of transparency and accountability around DPS’ vehicular stop and search patterns, and the legal, ethical and human consequences of racial profiling during traffic stops make an improvement to how DPS approaches racial profiling absolutely necessary.